
ugo
ugo's Achievements
-
 Rare
Rare
-
 Rare
Rare
-
 Rare
Rare
-

-

Recent Badges
0
Reputation
-
I dont do anything in particular in the draggable, you can easily reproduce with a regular demo from a phone in a low power mode
-
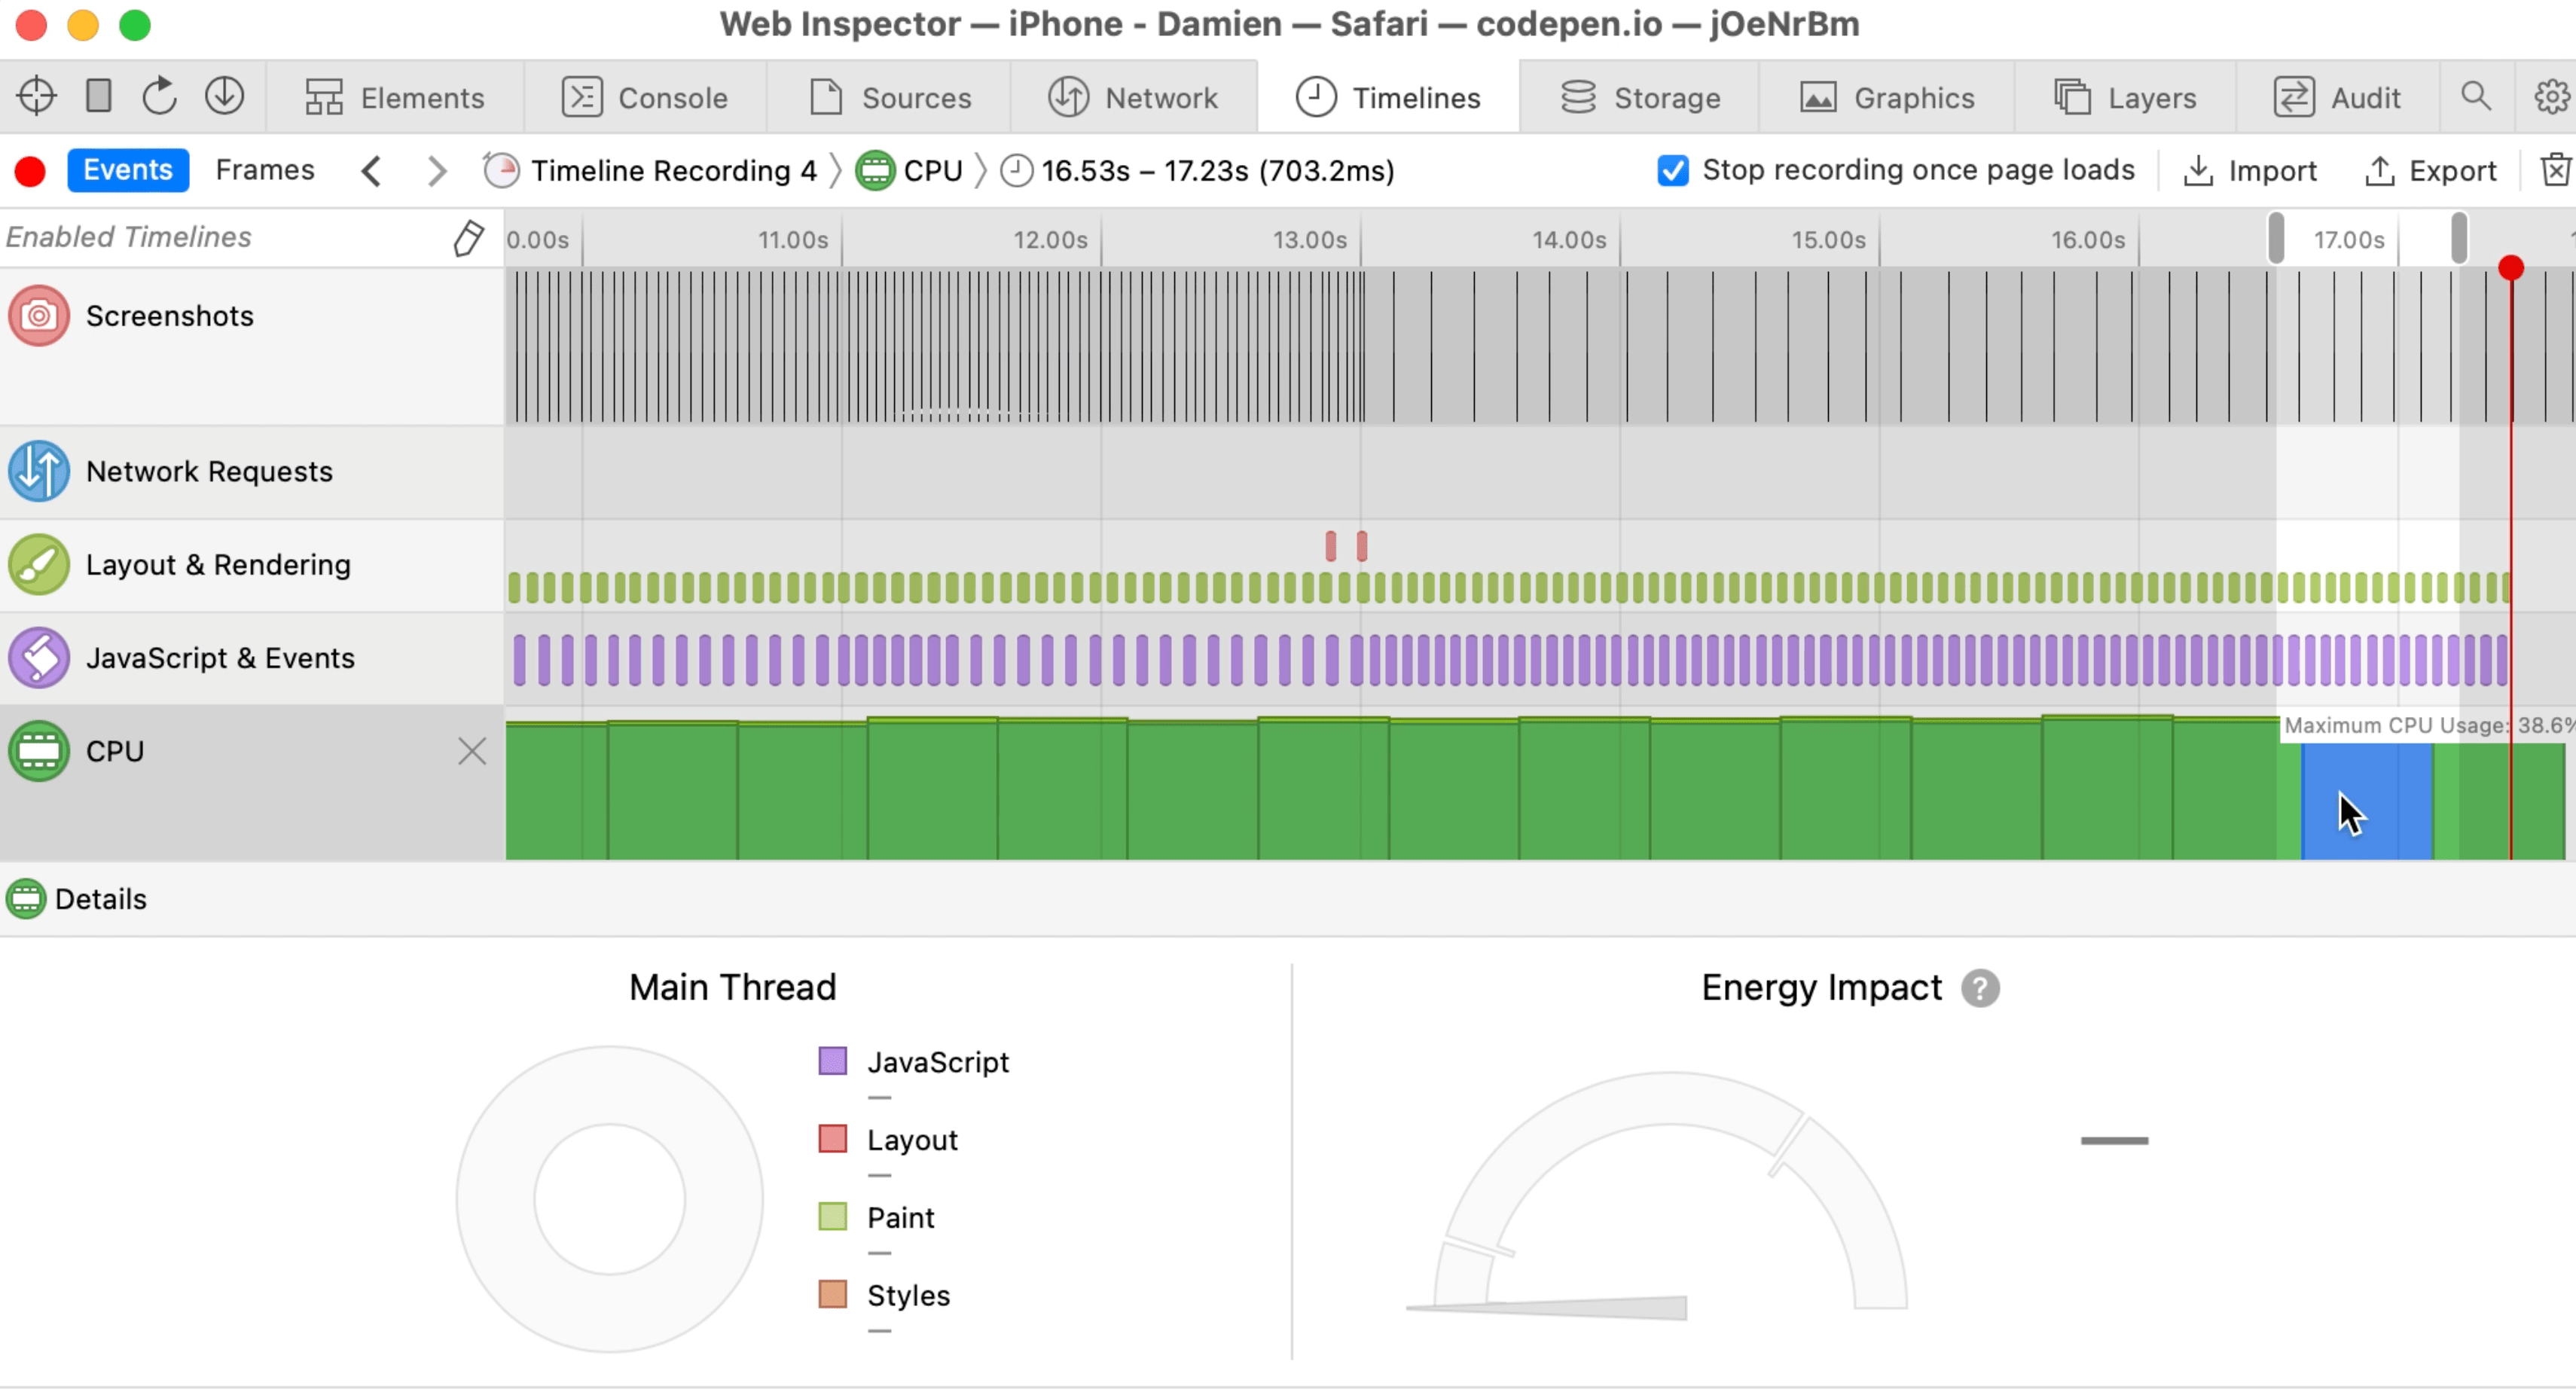
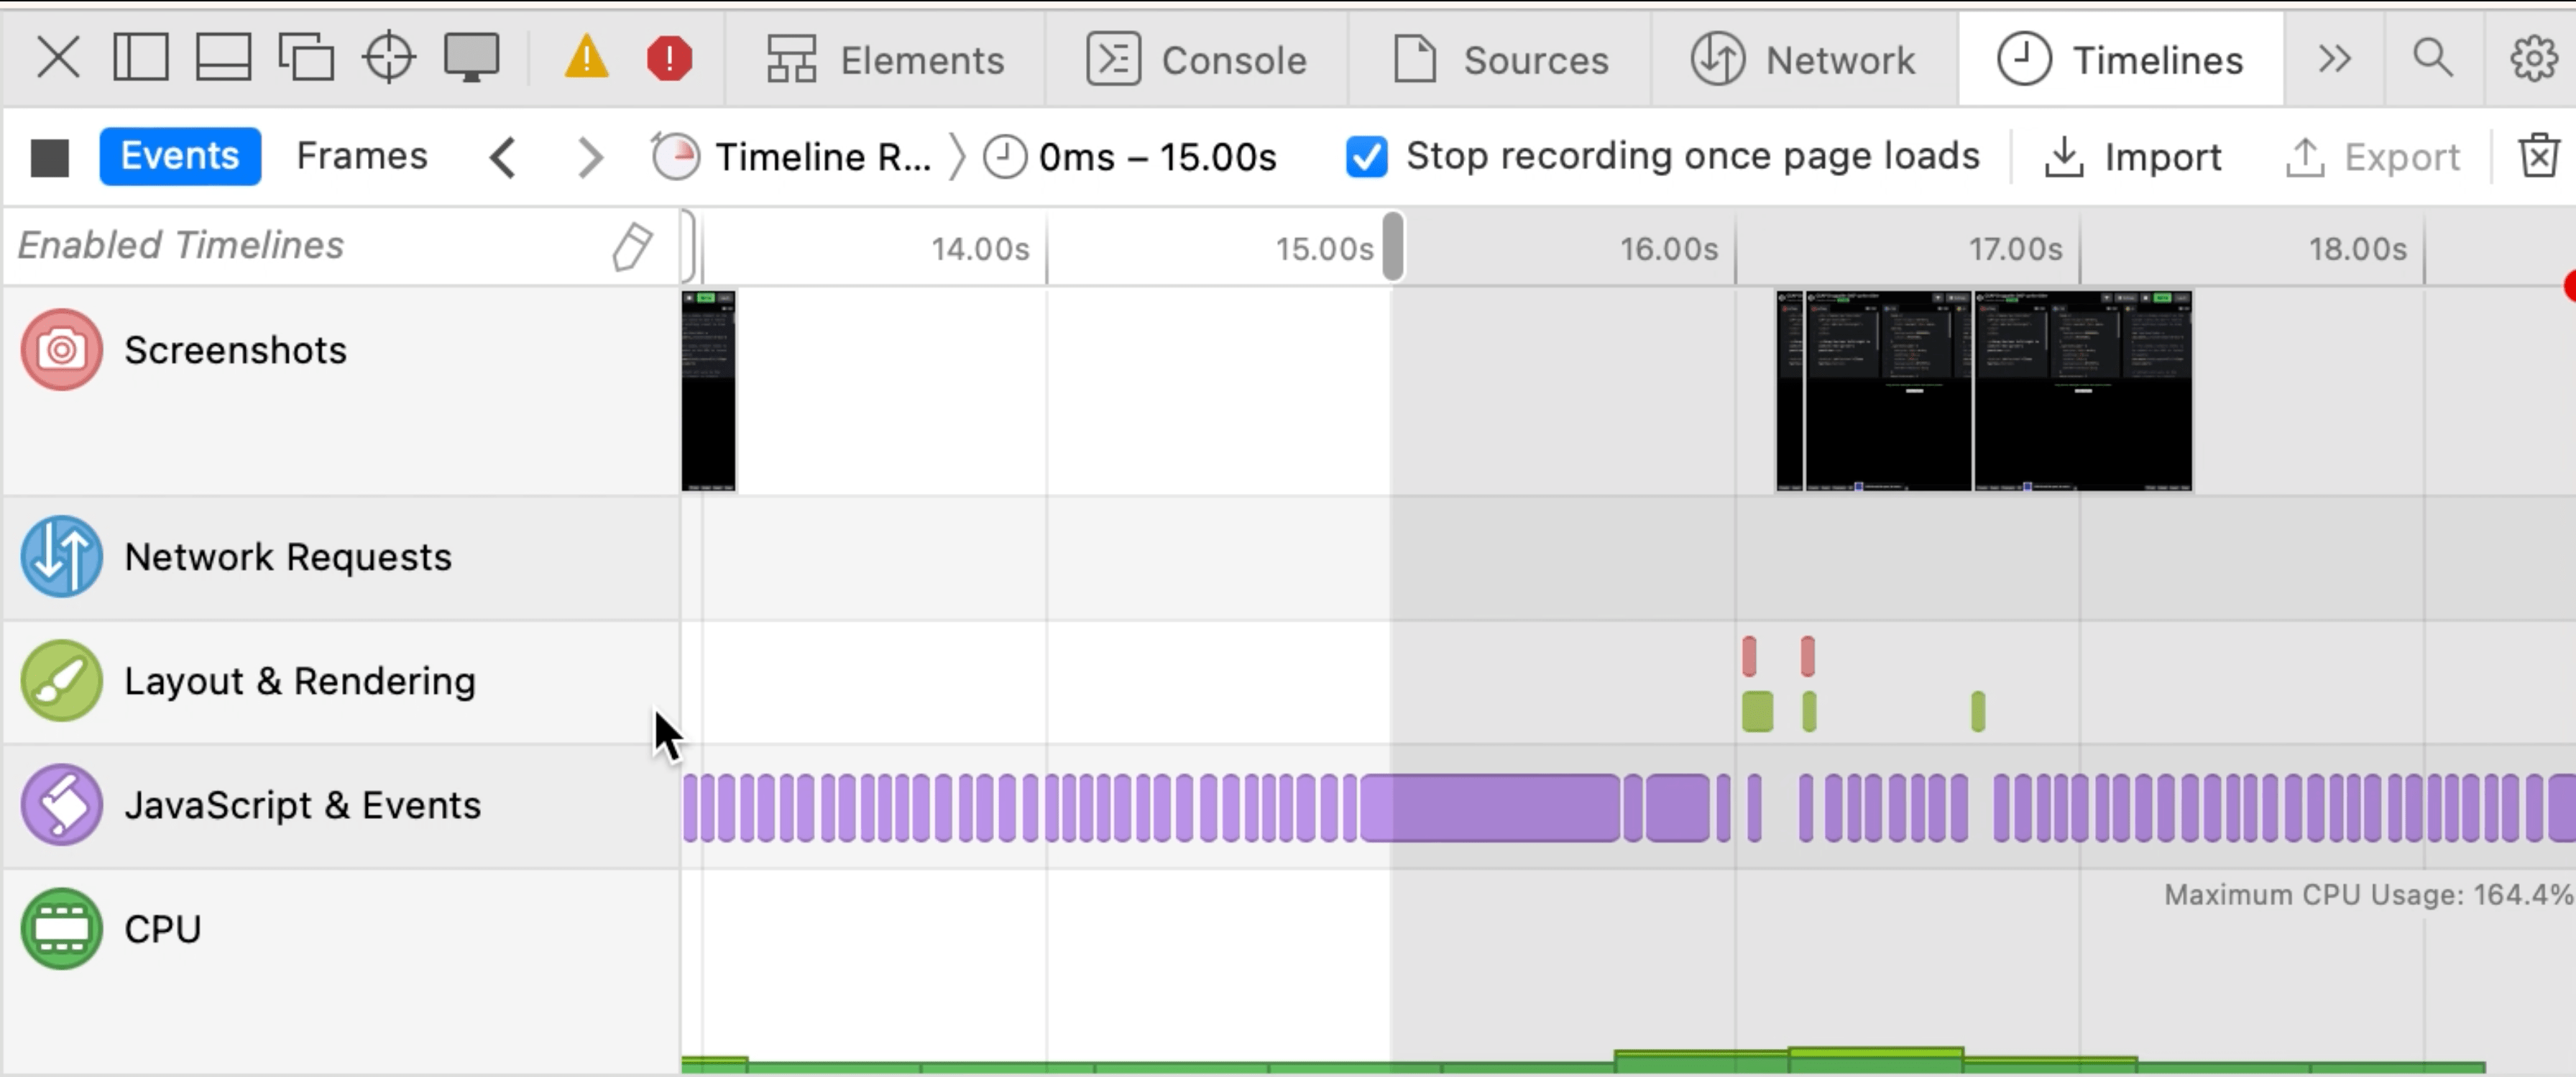
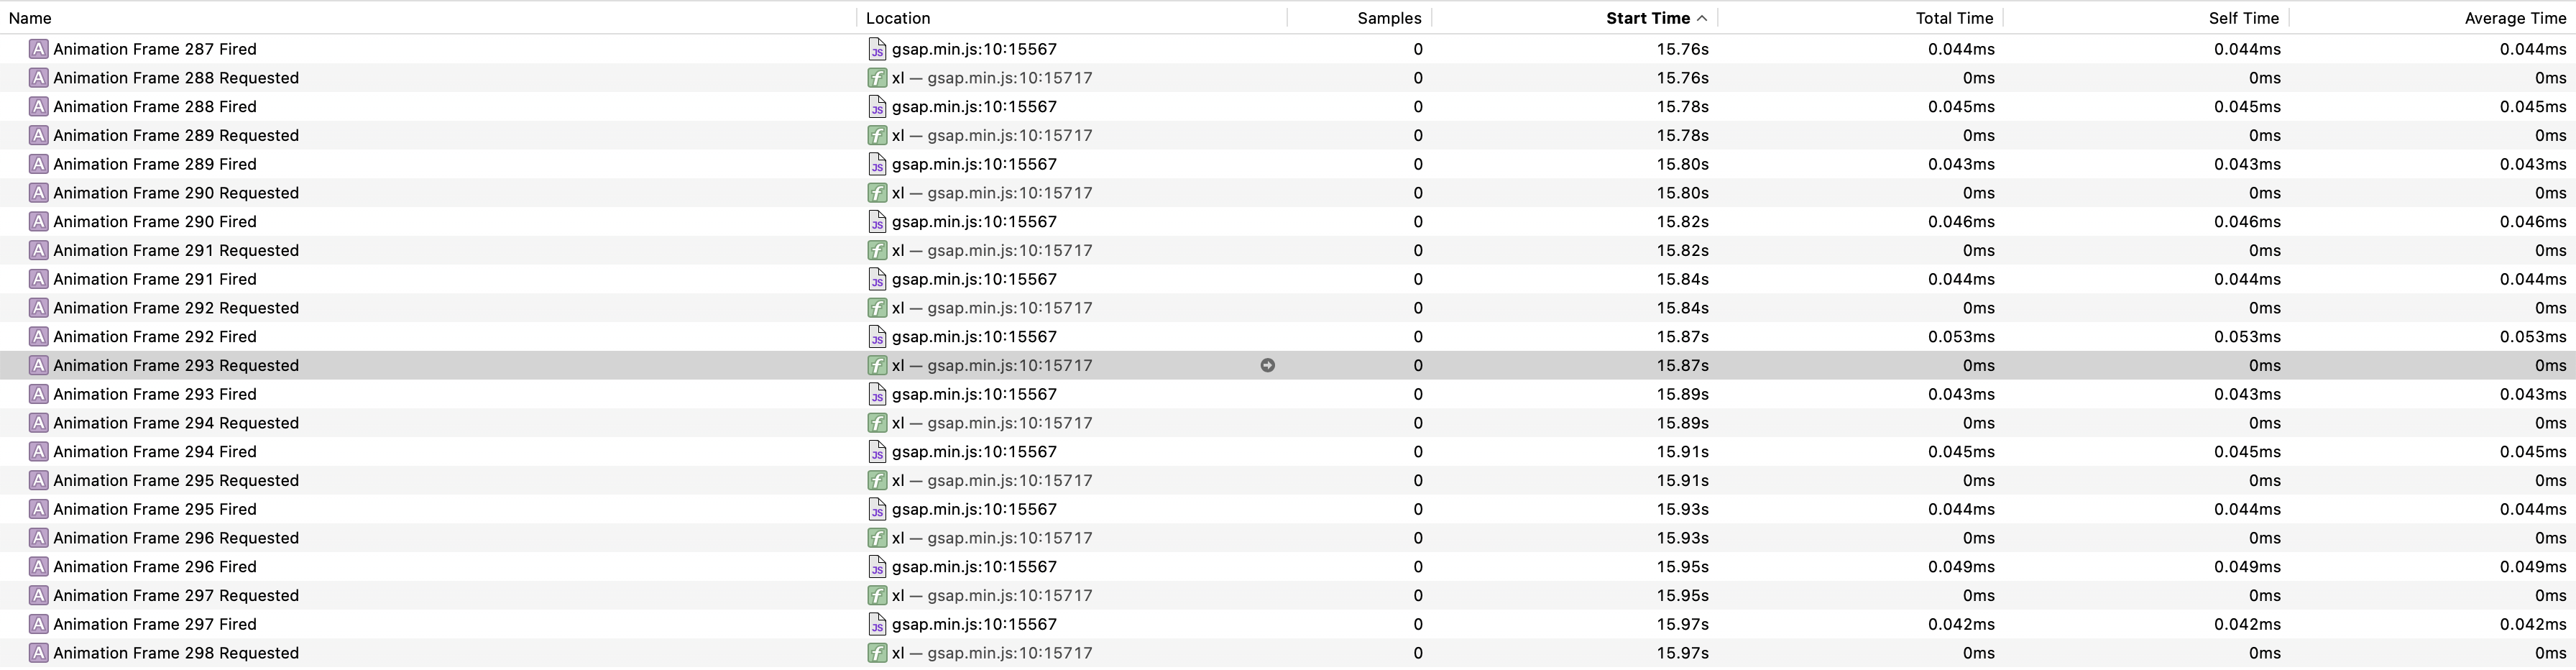
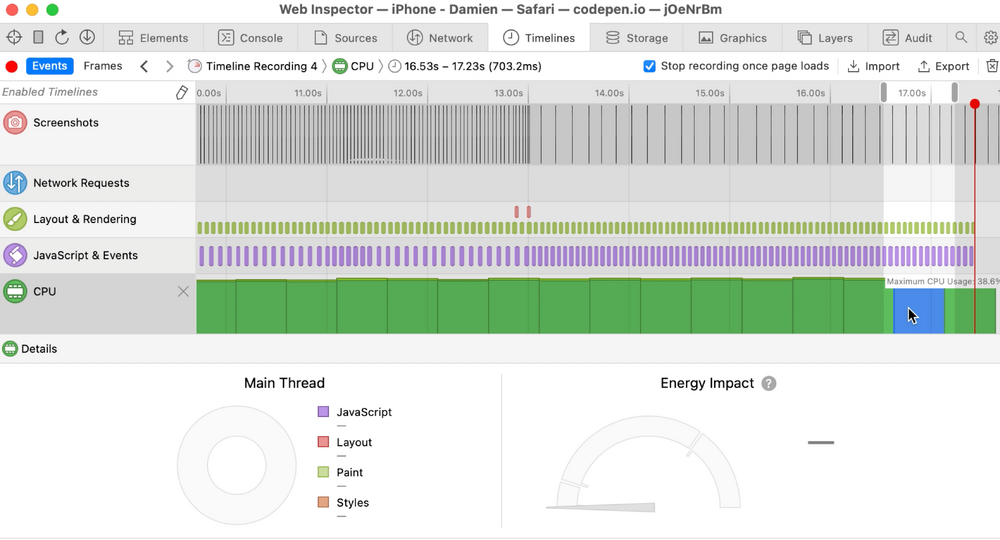
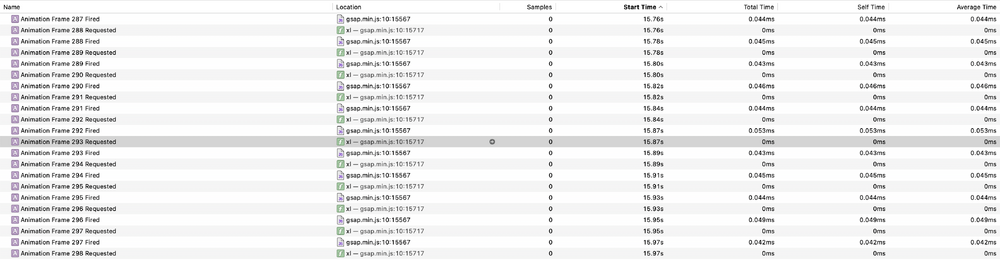
Hey, sorry we didnt notice that the codepen was set with GSAP 1, please find attached below the updated codepen using GSAP v3 https://codepen.io/darondel-yoobic/pen/jOeNrBm. Thanks for your recommandation about using the gsap.context method. We had been able to update our codebase to be working alongside the gsap.context but unfortunately this didnt fix our issue. When setting up the pattern we made sure that whenever the revert method from gsap context was called that all draggable instances was cleared, that was the case, however we still get a high CPU usage after calling the revert from the context. As for the previous codepen, you can simulate the issue by checking the codepen from an IOS device and then using the safari inspector, just go to Timeline > CPU and record ( red square on the top left corner ), you will notice that the CPU usage is already high on the first load of the component ( without any interaction with the element). And then just click the "close sprite" button below to simulate the revert and observe the CPU usage, you will notice that the CPU usage is still high pretty much like nothing had been discharged by the CPU after the revert, even though we checked that the draggable instance was destroyed on the post revert. Also, please find attached below 3 screenshot: 1. A screenshot from the video record of the CPU usage while loading the codepen from a safari on IOS 2. A screenshot from the video record of the CPU usage while loading the codepen from a safari on Web 3. A screenshot of the js/event logs processed after a revert from the context ( where the supposed the draggable instance should be cleared ). So as you can see, this might have an issue with discharging the CPU from IOS ( whereas this is working fine on Web, Android and Chrome ). We've tried to kill draggable instance manually and via the context and this lead to the same result. Any more idea to help us out ? or would you consider this to be an issue on your side ? Many thanks.

-
Hey. We've been working on trying to find the source of that issue but basically, whenever we try to instantiate the draggable instance with whatever Draggable(element, ops) or Draggable.create(element, ops), each time we are calling the draggable instantiation on IOS and then we try to umount the component it seems like the CPU usage is still the same and got never release from the instances call. We tried to call the kill method to destroy the instance to clear the CPU on the unmount hook of the component but this doesnt seem to work either. You can try checking my codepen from a IOS device and in the safari inspector, click on the Timeline tab and check the CPU usage. You'll notice that also on the first load ( without yet starting to interacting with the element ) the CPU usage is already very high (up to ~ 30% reproducible on Iphone XS IOS 14 ~ 16 the latest ). On Android as on web this seems to be fine tho. Let me know if you need more information or if you have any idea of how we could solve that, thx !
-
Hey, I'm facing an issue that i cant find any solution, i have tried different way to fix it but unfortunately, none of them are working. The issue is only reproducible from a real device when being set in Low Power Mode / Battery Saving mode. It seems like that whenever you are releasing the element, an then you start to grab it again, the latest will keep the previous last X/Y coordinates, ending with creating a gab between the element and the cursor/finger position when triggering the onPress. Solution I have tried, applying a gsap.set(element, { x: 0, y: 0 }) after releasing the element, calling the draggable.update() function after that. I'll be keen to be helped out on that issue. Thanks a lot in advance
-
Thanks Blake, it's working fine binding the this. And I use arrow functions because as the app is written in ES6, we have rules not to use regular function. Thanks for your help !
-
Hey, I recently build a progressbar component using GSAP. I was able to manage with the live display of the progress using the onUpdate function from the fromTo. It was working fine under the 3.0.1 version until it comes undefined with the 3.0.2. Is there anything I can do to fix that ? gsap.fromTo(activeBarElement, .5, { strokeDashoffset: getProgress(fromProgress) }, { onUpdate: (timeline) => { // since the 3.0.2 version GSAP, timeline is always undefined if(timeline) { console.log(timeline.progress()) } } }, strokeDashoffset: getProgress(toProgress), stroke: getCssColor(toProgress), ease: Linear.easeInOut });